· SoftIce tutorial - Part I basic ·

© 1997 by Icedragon / MiB


Getting started.....

Well, first of all you have to GET sofice somewhere... Check the links-page on the MiB-Homepage and go to Caligo's page, there is always a link to the newest s-ice versions on the net. Basically the most problems with "the ice", as crackers often call this precious tool, are problems with the display drivers for your graphic-card. This problem can only be solved by getting the NEWEST version of s-ice and/or get the display-adapters update on numega's ftp site... The 3.2 version also offers the use of a standard vga-driver which solves the problems for most cases if you also use the standard vga-driver in your windows as well. Read the manual for more information on it. As an aspiring cracker, you should be able to figure something out which works for your computer, so i wont explain here how to handle installation problems with toolz coz the solution always depends on your system configuration. And knowing how to *tackle* these problems needs experience and maybe a little ZEN as well, and i cant explain that... sorry....


What is Soft-Ice anyway ?

Soft-Ice is a debugger. A debugger is needed for a programmer to find flaws in programms, in order to fix them. By just looking at the source code of a programm it would be a hell of a job to find errors in it. So a debugger runs a programm in a controlled environment, in order to give the user the chance to interact with programm and intervene if something happens which might be of importance to find the bug. This possibility to interact on important occurences is provided through so-called breakpoints which the user must specify to the debugger. When the debugger notices that such an action occurs, it stops the programm flow and BREAKS into the debugging interface in order to give the user the possibiltiy to interact. One important possibilty to interact for the user might be SINGLE-STEPPING through the code, which means just executing one single instruction and then give control back to the user in order to see how e.g. the instruction changed other values or if it was excuted correctly etc... When the debugger BREAKS on a breakpoint, it provides vital information about the current state of the computer. This might be the current value of the registers (you need them DIRECTLY in asm, look into Crueheads fine asm tutorial and get familiar with the language coz you DEFINETLY NEED ASM-KNOWLEDGE to use soft-ice), or values of memory addresses (where important info for the programm might be stored e.g. a reg-code or passwords). With softice you can set breakpoints on memory-access *bpm* (when a programm reads or writes into a specific memory address), memory excution *bpx* (when a program executes an instruction stored somewhere in the memory), execution of windows-API-functions *bpx* (like Hmemcpy, GetDialogItemText etc...), IO-Port access *bpio* (


Basic Softice commands

Since you probably will be mainly working on windows-based programs, you will use breakpoints on the API-functions to get to the desired routines. In order to use these breaks in softice (meaning that the calls to the API's are displayed properly in the code and the breakpoints work) you have to modify the winice.dat file in your softice directory. In winice.dat, there is a section called Examples of export symbols for Win95... :

; ***** Examples of export symbols that can be included for Windows 95 *****
; Change the path to the appropriate drive and directory
;EXP=c:\windows\system\kernel32.dll
;EXP=c:\windows\system\user32.dll
;EXP=c:\windows\system\gdi32.dll
;EXP=c:\windows\system\comdlg32.dll
etc...

Here are all the dll´s listed for the common API functions that are used by windows programs. The ";" before each line indicates that these "exports" are currently disabled. Of courze, you need them to be enabled. To do this, just remove the semicolons in front of the EXP lines... Now, if you ever want to trace for instance a VB5 program, you will soon notice that these kind of programs call a special VisualBasic 5 (what an perversion of a programming language, YUK !) dll, namely MSVBVM50.dll . In order to be able to trace into these dll calls, you just add an additional export line which points to the MSVBVM50.dll (this will surely be your system directory for windows as well). So you insert the line... hey wait ! What the f**k am i doing here ? If youre not able to figure THIS one out, you should better get yourself Quake and frag ppl over the internet but you will never be a good cracker ! ;-) Of courze you can do the same with other programs who call unusual dll´s.
Now, while we´re here in winice.dat we can also modify the init-string for softice (you can add some initial settings here that are executed on every start of softice). The init string i use is INIT="wl;wr;ww 3;wd 3;wc8;watch eax;watch ds:si;watch es:di;" which sets watch-windows (they display the content of the given location permanently so you dont have to display them all the time with the "d " command) and toggles the different window-sections to a better view (note that the window-sections may be adjusted differently for your configuration). When you´re familiar enough with the softice commands you can add other ones to this string later on.
The installation of softice has added a line in your autoexec.bat file like C:\SI95\WINICE.EXE which loads softice into the background before windows is booted. It will rest there invisibly, until you press the key-sequence to pop up the debugging screen. The usual key sequence to bring up the softice-screen is ctrl+D (this can also be changed with the appropriate command in the INIT-String). If you only get garbage (hey ! asm-code and hex-values are NO GARBAGE !) after this, say like strange coloured keys, a system-crash, blank screen etc..., you might have (99% chance) a problem with your video-card and the s-ice display adapters. Refer to the Getting Started - Section at the top of this page to find a solution to this problem. If you are lucky enough that you get a proper screen, it should look like this:


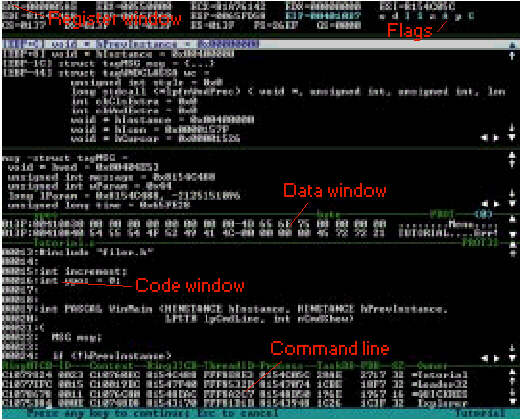
The screen on the picture is *slightly* different from the one you will get, coz you wont have the window-section between the Registers and the Data Window. This is due to the fact that you wont have any source code for the programs that you reverse engineer (it wouldnt be very wise to ask "why?" at this point...), so forget about it, okay ? Now to the marked windows... Everyone with a slice of ASM-knowledge knows what the registers are, so the register window is where the current values of them are shown. You can toggle this window on/off with the "wr" command. At the right hand of the Register window are shown the current states of the flags (the Zero-Flag is the most important one for our tasks, coz the execution of the conditional jumps jz, jnz etc. depend on it), if a flag is set its corresponding letter (eg. Z for the Zero-Flag) is highlighted. The data window displays data in memory, it is toggled with the "wd" command (if you want to display more lines for the data window you can set it to the desired state with "wd (number-of-lines)", use the same syntax for the other window commands... when adjusting one window you might have to adjust the other windows after that as well, so start setting the line-numbers for the top window and then go down respectively - otherwise you might mess up the other windows if you start configuring e.g. the code window first ;-)). You can display a specific memory location with the "d (location)" command, where location is the address in memory you want to examine. Underneath is the Code window, where the currently executing code part (in ASM of courze ;-)) is displayed. The highlited line shows the command which will be executed next. You can toggle this window with the "wc" command, "code on/off" changes the display of the opcode for the asm-commands. I guess that there is no need to explain the Command line, you simply type your softice commands here.
Now, i explained above that you need to set breakpoints on certain events in order to get to the desired code parts of the debugged program. There are a few commands in order to make work with these breakpoints a bit easier. First thing is to list all your current breakpoints you have set, you can do this with the "bl *" command. S-Ice then lists you the breakpoints in the order of setting (each Breakpoint has a number assigned to it by softice at the time of setting it, so the first breakpoint you set gets number 0, next one 1 etc...). When a breakpoint isnt of importance anymore after you breaked on it for the first time, you can disable it. Lets say for instance you breaked on hmemcpy (used for copying strings in memory) in order to find a serial-number check. After you found the code part with the serial-check, you might not want to get disturbed in your stepping thru the code by other uses of hmemcpy because you want to step over other string routines and focus on the compare at the end of the check (or maybe on the martini, who knows ?). Then it would be wise to disable the breakpoint on hmemcpy with the command "bd (number-of-breakpoint)". You can disable ALL active breakpoints with "bd *". To enable the breakpoint again, use "be (number-of-breakpoint)" or respectively "be *" for all of them. If you want to remove a breakpoint completely from the list (no matter if its enabled or disabled) you can do that with the "bc (number-of-breakpoint)" command or "bc *" to clear the whole list. These commands come in handy when checking for several different occurences, its a nice feature so use it !
The thing you will do most of the time when debugging a program will be the stepping thru the code. The highlighted line in your code-window marks the next line of code that WILL BE EXECUTED (so its not executed yet !). In order to single-step (that means to excute the next single line of code) you use the "t" command. If the next line of code is a call, you can SKIP the stepping INTO the routine by pressing "p" which steps over the call (its executed as well, you just dont step INTO the subroutine) and stops at the next line after the call. You will need "p" or F10 quite often, coz you will find a lot of uninteresting windows and system-calls you want to step over. In case you step into a routine you want to get out of (meaning returning to the code-part that called this sub-routine) you simply press F12. Thats easy, isnt it ?


Setting breakpoints on API functions....

In order to break on the proper system events in Windoze, you have to know the names of the API-functions used for the process. You set a breakpoint with "bpx (name-of-API-function)" like eg. bpx GetDlgItemText, bpx stands for breakpoint on EXECUTION. To make it easy for those who dont have an API reference from Microsoft yet, here is a link to +Greythorne's GREAT list of API calls needed for cracking (its a must have !!!!).

Windows-API's
A Reference is nonetheless vital for cracking, coz you see the use of a function as well as the return values (and their location). Study the list from +Greythorne its pretty self-explanatory and i dont have anything to add there. I guess here is the end of the basics part of the s-ice tutorial. It should be a start to get yourself familiar with the debugger, i will explain the more advanced things in the second part (which you will also find on the MiB-Homepage obviously, so check back often).


For comments, complaints or blackmail, drop me a line at: icedragon@thevortex.com

Copyright © MiB 1998. All rights reversed.