ASMFLOW Professional is an assembly language flow charting and source code analysis tool for the IBM PC.
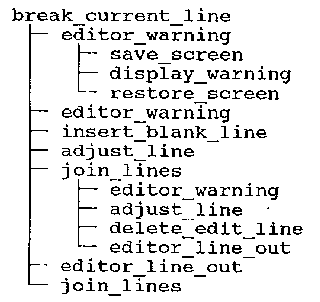
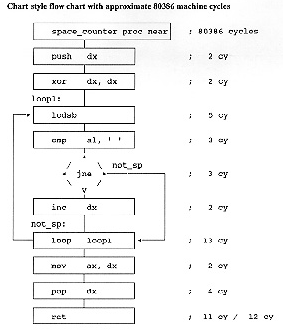
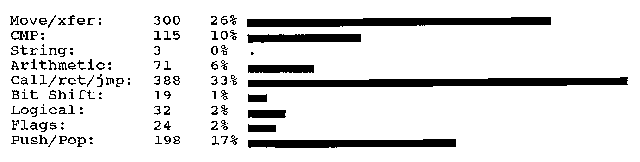
ASMFLOW generates flow charts, tree diagrams, register analysis, cross-references, stack sizing information, approximate timing information and more, directly from your assembly language source code or listing files.
ASMFLOW is primarily a source code documentation tool, but it has a number of features designed to help you debug and analyze your code. For example, the register analysis feature (see next page) helps determine the inputs and outputs of each procedure.
Nothing can replace a programmer's skill in analyzing program execution with a debugger, because only the programmer knows what the results of each part of program should be like. However, using ASMFLOW is like getting a fresh objective look at your code by another programmer.
ASMFLOW Features:
  Flow charts                       CPU timing in flow charts
  Tree diagrams                     Marks recursive code
  Stack sizing                      Macro expansion
  Register analysis                 Conditional assembly
  Approximate CPU timing            List, wildcard or MAKE input files
  Instruction frequency histogram   Menu, batch, or command line operation
  Comments in flow charts           Up to 1500 procedures, 5000 calls
  Data symbols X-ref                Processes source files or .LST files
  Marks instructions that affect CPU flags
  80x86 version handles 8086 thru Pentium
ASMFLOW supports all printers by generating only ASCII characters as output. The best output uses the extended- ASCII line drawing characters, but choices are available for printers that do not support this. Special HP Laserjet formats are provided for condensed printing in portrait and landscape modes.
No, ASMFLOW is not a disassembler. You must supply ASMFLOW with a source file (i.e. a .ASM file). The output of a disassembler can be used as an input to ASMFLOW.
All features are completely automatic, except the approximate timing analysis. This feature assumes that each instruction executes one time. You may then insert commands (embedded in comments in the code) that give a minimum and a maximum number of times that a given loop or block of code is likely to execute. All timing information is given as a minimum and maximum range.
Each instruction in a procedure is analyzed to determine every register modification and use. Based on the type and order of these operations and every PUSH and POP, a table is generated for each procedure that identifies all register usage and which registers are inputs and outputs. (See example, next page.)
Macros are supported in two ways. First, you can specify that macros are to be treated as high level constructs, showing up in tree diagrams like a procedure call. Second, you can have macros expanded, thus becoming visible to the register analysis and all other ASMFLOW features, such as flow charts and tree diagrams.
     8088 - Pentium             8051 family
     8080/8085                  Z-80, Z-180, 64180
     80x96                      1750A
     68HC05                     68HC11
     6303                       6502
All versions produce flow charts and tree diagrams, as a minimum. Most versions include the register analysis and approximate timing information. New features and versions are always being worked on so call for the latest information. If you would like a version of ASMFLOW for another CPU, contact us about doing a conversion.
     space_counter proc near
     ;--------------------------------------
     ;            ax  bx  cx  dx  si  di  bp
     ; input:      0   0   1   0   1   0   0
     ; output:     2   0   1   0   1   0   0
     ; modified:   2   0   1   2   1   0   0
     ; used:       3   0   1   3   1   0   0
     ; pushed:     0   0   0   1   0   0   0
     ; popped:     0   0   0   1   0   0   0
     ;
     ; input:     cx  si
     ; output:    ax  cx  si
     ; modified:  ax  cx  dx  si
     ; used:      ax  cx  dx  si
     ; pushed:    dx
     ; popped:    dx
     ;--------------------------------------
     space_counter endp

     space_counter proc near  ; Sample code
     ;----------------------
     ; inputs: DS:SI ptr to string
     ;         CX len of string
     ;
     ; outputs: AX   count of spaces
     ;----------------------
              push    dx
              xor     dx, dx     ; zero init count
     loop1:   lodsb              ; read char from string
              cmp     al, ' '    ; compare to ASCII space
              jne     not_sp     ; jump if not a space
              inc     dx         ; inc count of spaces
     not_sp:  loop    loop1      ; loop until end of string
              mov     ax, dx     ; return result in AX
              pop     dx
              ret
     space_counter endp
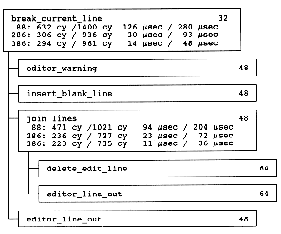
numbers in upper right corner are stack depth
timing information is shown as min/max for cycles then min/max for
seconds