The discone antenna:
A small, wide band antenna that behaves similar to a dipole in radiation pattern and characteristics. Often used in lower frequency applications, especially in scanners for its high bandwidth ability, discones are common on many buildings. We even have one mounted on top of the Ad Building here at Walla Walla. We chose this antenna for its simple construction and relative insensitivity to "design features" (flaws).
Our Goals
It was our goal to implement an antenna for the 802.11 (wireless ethernet) specification. This covers the bandwidths of 2,400 MHz to 2,440 MHz. Our goals were higher gain than the card antenna, smaller size and greater portability than current external antennas and omni-directionality for use in a mobile enviroment. We also tryed to keep costs under control.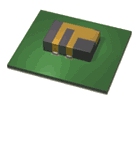
Our Results
Our gain was as high as 8 dB over the best gain of the internal antenna in the Lucent card. Our overall dimensions were 3x3.75x3.75 centimeters. We fed our antenna using standard 50 Ohm thin coax and connecters rated for 2.4 GHz, probably availible at your local Radio Shack. The antenna was fabricated from a short section of copper tubing often used in plumbing and copper foil used for RF shielding in the electronics industry. Aluminum may also work well. Our impediance was 56 + j 7.5 and resulting SWR was 1.4. The antenna should be mounted on a laptop or Palm by means of a simple bracket that would hold the antenna vertically from the top of the screen. We suggest using Velcro to attach the bracket to the computer and the coax connector to hold the antenna in place.Building a Discone
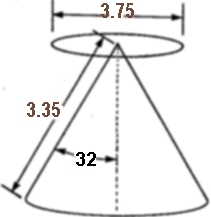
In building a discone we used the plans from the ARRL Antenna Book 19th edition. They suggest using an angle theta of approx. 64 degree angle on the cone and 7/10 ratio of disc diameter to bottom of the cone. The height of the cone should be approx. 246/(frequency in MHz) meters. after building a discone of these dimensions, we discovered that by increasing the size of the disc slightly we could decrease our SWR greatly, while only slightly decreasing radiated power (less than 1%). This was discovered on the slotted line using aluminum foil to alter the dimensions of our antenna to optimize the SWR.To construct the cone:
Smith Chart w/Calculations
Sim. Azimuth Results
Sim. Zenith Results
Testing and Optimization
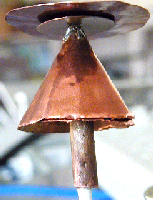
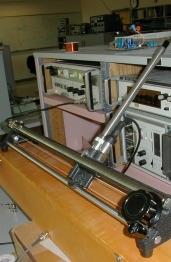
To test SWR and impedance we acquired a 2.4 GHz function generator with AM modulation and a slotted line with the help of our professor Dr. Rob Frohne. A slotted line is simply a length of 50 ohm transmission line that has a slot down the center with a slider that senses the voltage along the line through some sort of capacitive coupling. This is attached to a meter which allows you to read SWR and find voltage maxima and minima. From simulation we determined the biggest adjustment that can be made to the cone is adjusting the length between the disc and the cone. Since our design doesn't allow for such change easily we simply bent the disc up and down slightly. We also used aluminum foil to increase the effective surface area of our disc and cone structures. We were aiming for an optimal SWR of approx. 1:1 and impedance of 50 ohms. We finally measured 1.4:1 SWR and 56 + j 7.5 ohms impedance.Finding Impedance on a Slotted Line
Measuring Radiation Pattern
To measure the radiation pattern of our antenna we set up a test range in the lawn in front of Kretchmar Hall. Our reference antenna was a 25 dBi gain Cushcraft Yagi pointing towards the test antenna. We planned our site in such a way to avoid reflections from nearby buildings and absorbtion from people walking in between the antennas. The discone was mounted on a soldering stand that was mounted on a camera tripod. Our reference antenna was plugged into a Mac Airport. The discone was plugged into a Lucent Bronze 802.11 card plugged into a Dell laptop running the Link Test Software that came with the Lucent card. The link test gives the signal strength, noise strength and signal to noise ratio in dB. We then rotated our antenna in several different axes using the tripod, recording the values in each spot. We then graphed the values in MS Excel using radar plots and several nifty tricks to get it to come out looking right.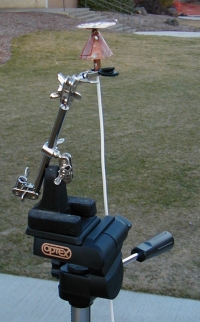
Azimuth Results
Zenith Results
Below are graphs of our results. Click on the image to view larger versions.
Simulation Graphs
 |
 |
 |
 |
| SWR vs. Frequency | Zenith Plot | Azimuth Plot | Model of Simulated Antenna |
Real World Testing Results
 |
 |
 |
| Zenith Plot | Azimuth Plot | Smith Chart with Calculations of Impedance for discone |
Comments:
Standing Wave Ratio (SWR)As is typical for a discone, our antenna acts as a high pass filter. We designed for the best SWR at 2.4 GHz. Note that SWR before 2.4 GHz looks exponential and at higher frequencies appears linear.
Zenith
The typical radiation pattern for a discone is doughnut shaped as shown in our simulation and real world tests. The slight tip in our simulation seems to result from a strange abnormality in the current distribution of the NEC simulator. Note that the dB indicated on the real world graphs are dB received in the test not a reference measurement.
Azimuth
The Azimuth plots should be fairly circular. When comparing these graphs, notice that the scales on each graph are different. The irregularities on the real world test are probably due to bends in the foil and imperfections in the cone and disc dimensions.
Thanks and Links:
Thanks:Dr. Rob Frohne -- Advice and rather effective encouragement to finish our project.
Ralph Stirling -- Letting us borrow his yagi and adapters for testing.
John Ash -- Letting us borrow his laptop and yagi for testing. Advice on choosing a testing program.
Seth McNeill -- For mocking our design. Ha Ha it worked anyway!
Greg Kittle -- For being a wonderful grader and for all the extra credit we are getting for saying that!
David Paden -- For being such a great supervisor and picking up after Tim. Incredible insight and making all of the lousy ideas go away.
Tim Kyle -- For leaving parts all over Chan Shun. Oh yeah... and on a job well done.