By Paul Hendriks, Analog Devices, Inc.
The wireless industry has been racing towards digital technology over the past several years. To keep pace, today's manufacturers are focusing their efforts on developing components, chip sets, and boards to meet the growing and changing needs of wireless system design engineers. One component that has found huge demand in this new digital arena is the high performance digital-to-analog converter (D/A).
In digital wireless systems, many of the D/As are used in the transmit signal path to reconstruct the complex analog waveforms demanded by various sophisticated digital modulation schemes. Frequently, the performance of the D/A under the specified system operating conditions will not merely affect the performance of the target system, but will actually determine whether a particular modulation scheme or system architecture can be implemented at all. Thus, it is imperative that system designers focus on the specifications and characterization data which has the most relevance in their application during the initial product selection.
As many engineers know, when selecting a D/A for wireless applications, standard static and time-domain specifications for linearity, resolution, settling-time, and glitch impulse need to be supplemented with additional parameters. Some of these additional parameters include flexibility, ease of integration, power consumption, power supply requirements, and cost.
Frequency Domain
Wireless systems and their components are usually analyzed and characterized in the frequency domain. As a result, a high-speed D/A is primarily evaluated using specifications and characterization data pertaining to its frequency domain (AC linearity) with secondary consideration given to its static (DC) and dynamic (time-domain) specifications. Analysis is performed in this fashion because static and dynamic nonlinearities will manifest themselves in the frequency domain. In addition these nonlinearities contribute to a D/A's large- and small-signal distortion performance beyond what would be predicted by the process of sampling and quantization.
An analysis of the reconstructed time-domain output of an ideal and non-ideal D/A reveals why this is the case (Figure 1). Various deviations from the ideal response will result in distortion and noise in the frequency domain. The dynamic nonlinearities, which include a glitch impulse and slewing period, occur during the transition phase of the non-ideal response. Note, in this example, the glitch impulse's code-dependency, as opposed to its mere existence, is just one of several sources of frequency domain distortion. As a result, glitch energy is an unreliable indicator of a D/A's frequency domain performance. A D/A's code-dependent (i.e. nonlinear) settling time characteristics is another major, and often overlooked, source of D/A distortion. Stepped response will also contain some residual digital data and clock feedthrough. This residual data and feedthrough manifests itself as additive noise in the frequency domain.
After the non-ideal D/A settles to its steady-state value, the difference between the ideal and non-ideal DC power levels to determine the static error of the D/A.
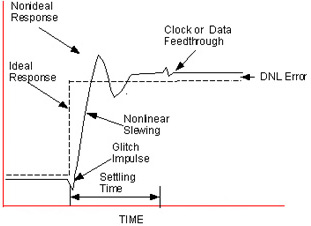
Figure 1:
Analysis and characterization of the D/A is performed in the frequency domain since both static and dynamic nonlinearities manifest themselves in this domain.
Although the actual effects of dynamic nonlinearities on a D/A's frequency domain performance are nearly impossible to predict, certain observations can be made from Figure 1. As the code-to-code step size and/or update rate increases, the error attributed to dynamic nonlinearities will begin to dominate those errors attributed to static nonlinearities. Stated differently, the amount of distortion induced by dynamic nonlinearities increases as the frequency and/or amplitude of the reconstructed waveform increases.
Typical Characterization
When running typical frequency-domain characterization measurements, the engineer generally drives the D/A with a series of digitally synthesized full-scale sine waves (i.e. single-tone) at various update rates. The resulting output signal's spectrum is then analyzed to determine the amount of additive distortion and noise.
When performing characterization measurements, spurious-free dynamic range (SFDR), perhaps the most often quoted DAC specifications, defines the difference, in decibels, between the root-mean-square (RMS) power of the fundamental and the largest spurious signal within a specified band. SFDR is typically specified over the full Nyquist region extending from DC to one-half the data update rate (i.e. FCLOCK/2). However, it can also be specified over a narrowband, or window, which purposely excludes the worst spur (Figure 2).
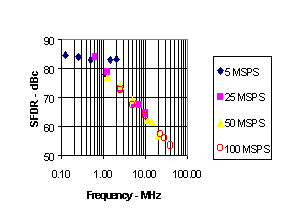
Figure 2:
In a D/A, SFDR is typically specified over the full Nyquist region extending from DC to one-half the data update rate.
Analyzing a D/A's SFDR performance vs. amplitude at different output frequencies reveals its small-signal linearity. By uncovering small-signal linearity, the engineer can obtain excellent insight into a D/A's performance in a real world wireless communication application in which the reconstructed output signals are not simple full-scale sinewaves having a peak-to-RMS ratio of 3 dB. On the contrary, these complex waveforms may consist of one or more amplitude and phase modulated sinewaves whose peak-to-RMS ratio often exceeds 12 dB.
In cases where peak-to-RMS exceeds 12 dB, full-scale single-tone operation can often be a deceiving indicator of a D/A's performance since, as a histogram reveals, a heavier concentration of code transitions tend to occur at the D/A's midscale value instead of its peak values. Similarly, selecting a communication D/A purely based on resolution, settling time, DC accuracy, and glitch energy can often provide results far worst than anticipated .
Figure 3:
The 12-b AD9762 converter outperformed a 14-b BiCMOS D/A during a performance comparison of SFDR vs. amplitude.
A comparison of SFDR vs. amplitude performance between a 12-b D/A, such as the AD9762 developed by Analog Devices, and a 14-b BiCMOS D/A demonstrates this point (Figure 3). Based on the static linearity and dynamic specifications stated in each product's datasheet, the 14-b BiCMOS provides an advantage in resolution, settling time, DC accuracy, and glitch energy. Both D/As, however, were updated at 25 and 100 MSample/s sampling rates while reconstructing an output frequency of 5 and 20 MHz. The SFDR was plotted relative to a full-scale output. This approach showed that SFDR performance of the 12-b D/A actually improved as the amplitude is reduced while the 14-b device's performance remains relatively unchanged. At both 25 and 100 MSamples/s, the 12-b device begins to display superior SFDR performance for single-tones below -4 dBFS. For reconstructed amplitudes below -9 dBFS, the difference in SFDR performance between the 12-b and the 14-b BiCMOS DAC can be as great as 10 to 15 dB, proving that resolution doesn't necessarily guarantee dynamic range.
References:
1. "Specifying Communication DACs" by Paul Hendriks in IEEE Spectrum, July 1997.
2. Datasheets for Analog Devices' AD976X TxDAC Family of 8-to-14-b CMOS D/As
Paul Hendriks, Senior Applications Engineer, Analog Devices, Inc., Ray Stata Technology Center, 804 Woburn Street, Wilmington Street, Wilmington, MA 01887. Tel: (781) 937-1428; Fax: (781) 821-4273.