
MARCH OF THE TITANS - A HISTORY OF THE WHITE RACE
Chapter Sixty Seven
The Changing Face
The dominating theme of European history in the last quarter of the 20th century has been the large scale immigration of Nonwhite peoples and races into the modern era White heart lands of Northern Europe, Australia/New Zealand and North America.
This process has taken place via two avenues: legal immigration and illegal immigration: it is difficult to formulate estimates on which has been the greater. Whatever the channel used, the reality of masses of Nonwhites settling in these territories can quite rightly said to be changing the face of these continents.
EUROPE
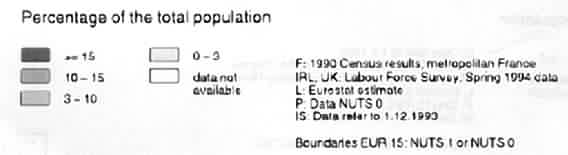
According to Eurostat (the Statistical Office of the European Communities, B-19049 Bruxelles, rue de la Loi 200, Luxembourg), in their publication, Migration Statistics, 1996, there is not one of the 15 countries in Western Europe (their area of measurement) which, at the beginning of 1994, did not have less than 3 -10 per cent of what they euphemistically call "non-nationals resident".
France, Germany, Austria, the Benelux countries, Denmark, Scandinavia and England are all listed as having "non-nationals resident" of more than 10 per cent, with Germany in two regions registered figures of "more than 15 per cent."
An average of between 10 and 15 per cent of "non nationals resident" in Western Europe as of the mid 1990's is therefore an accurate estimate, given that official figures are always behind actual statistics, as the number of illegal immigrants always closely shadows the number of legal immigrants.
By 1994, most European Union member states had an average 10 - 15 per cent Nonwhite population, with this figure effectively doubling every fifteen years. These statistics are from the EU's own official records, Eurostat, in Belgium.
"Non-Nationals Resident" and "Less Developed Countries" are Codewords
These "non-nationals resident" are, according to the Eurostat figures, in the majority derived from that the "less developed countries" which are officially listed as: "Turkey, Africa, Latin America (excluding America and Canada); Asia (excluding Japan); Oceania (excluding Australia and New Zealand." (Migration Statistics, 1996, Eurostat, page xvii). It is clear that the terms "Non-Nationals Resident" and "Less Developed Countries" are therefore codewords for Nonwhite.
Nonwhite Majority by 2090
If it is calculated that Nonwhite immigration into Europe first started in significant numbers during the late 1950's and speeded up considerably during from the 1970's, it can be seen that the exponential growth rate means that the Nonwhite population of Western Europe is successfully doubling approximately every fifteen years. This rate of growth, left unchecked, means that Europe will have an outright Nonwhite majority population by the second half of the 21st century - by the year 2090.
France
The largest source of Nonwhites into France has come from North Africa: it is estimated that 6.95 million legally present Nonwhite immigrants in France (of the total estimated 12 million Nonwhites population of that country) originate from just three countries: Algeria, Morocco and Tunisia.
Number of North African Immigrants in France:
| 1946 | 100,000 |
| 1954 | 250,000 |
| 1962 | 400,000 |
| 1968 | 800,000 |
| 1975 | 2.4 million |
| 1982 | 1.5 million |
| 1990 | 1.4 million |
| Total (in 1990) | 6.95 million |
Source: BBC News website www.bbc.co.uk, 13 March 1998," France Tops Europe Racist Poll"
These figures do not take into account illegal immigration. It is not surprising that immigration and race relations have become important issues in France in the 1990s. High unemployment and violence mark the Black and North African communities in France and have provoked serious emergencies in the Parisian capital.
Racial Mixing
As in other European countries, the numbers of Nonwhites are being increased not only by natural reproduction rates, but also by mixing with Whites. The 1990 census in France showed that where young Algerian women had live-in partners, in nearly a quarter of cases the partner was White; and the younger the Algerian women, the higher the proportion of White partners.
In 1975, the French census figures showed that for Algerian mothers, the proportion of births where the father was White rose from 6.2 per cent, to 27.5 per cent in 1990. This in effect means a dramatically increasing mixed race younger generation, who are not counted as "non-resident nationals" by the Eurostat calculations, but who are not White either.
Germany
The largest source of Nonwhite immigration into Germany has been from Turkey, although the liberal asylum laws that country had until the mid 1990s encouraged several million other Nonwhite immigration waves from Africa and Asia as well.
The German constitution adopted immediately after the Second World War compelled the country to accept virtually any refugee who was fleeing political or social violence in their home countries. As most of the Third World is continuously in strife, this was easy enough to prove, and at least a million, and possibly more, Nonwhites entered Germany in this way.
This constitutional provision was only changed after public pressure in Germany mounted to the point where it became a national crisis. The result is that there are an estimated 7 million "foreigners" (as the Germans like to codeword Nonwhites) in Germany at the end of the 20th century, the majority of whom are Turks. This has created its own set of social problems in Germany: an international conference in Hungary in June 1998, on illegal migration, was told by the German Interior Minister said that foreigners were behind two-thirds of the crimes committed by organized gangs in that country. This issue of foreigner crime has become one of the dominating political issues in Germany, with all mainstream political parties building it into their policy programs.
Racial Mixing
The number of racially mixed children in Germany which has resulted from the huge Nonwhite influx, has been substantially smaller than in other European countries: according to the German census of 1975, the number of Turkish mothers giving birth to children with a White father was 0,5 percent - by 1990 this figure stood at 1.2 percent.
Britain
Britain actively encouraged Nonwhite immigration from the Commonwealth, starting in the late 1950s. The flow of Nonwhite Commonwealth immigrants has hardly paused since, changing massively the make-up of several major British cities - where the immigrants have tended to concentrate.
The vast majority of immigrants have come from three sources: India/Pakistan, the West Indies and West Africa. A measure of the level of Nonwhite immigration into the UK can be gauged from the 1996 statistical survey by that country's Office of National Statistics, which showed that country wide, the 36th most popular name for new babies in the UK was "Mohammed" - an exclusively Muslim name.
Official estimates put the number of Nonwhites in Britain at the end of the 20th century at around 3.5 million - but this does not take into account illegal immigration, which is massive: the Metropolitan Police in London has estimated that there at least half a million illegal immigrants in greater London alone, never mind other Nonwhite concentrations in Birmingham and elsewhere.
A more accurate figure for the total number of Nonwhites in Britain as at the end of the 20th century is probably closer to 5 million, even more if the extremely high number of mixed race children are added in.
Racial Mixing
Racial mixing has been extremely prevalent in Britain. According to the 1991 census, taken by the Office for National Statistics in London (ONS), 40 per cent of young Black men in Britain are married to, or live with, a White partner. The trend is less common on the other side of the sexual divide, where one in five young Black women has a partner who is White. (Ethnicity in the 1991 Census, ONS, 1991).
In 1990 One Fifth of all Pre-School Children in Britain Were Nonwhite
The ONS census in 1990 also revealed that some 20 per cent (or one in five) of pre-school children in Britain was of mixed race, and the percentage is rising year by year (ibid).
Other facts revealed in the 1991 census showed that:
Britain has, as a result of this large Nonwhite influx, suffered a large number of Black riots, the most serious of which occurred in 1981, when countrywide riots saw large areas of many inner cities razed to the ground.
UNITED STATES OF AMERICA
Third World Immigration Starts After 1960
Until the 1960s, most immigrants to the United States came from Europe. Mexicans had however long since been crossing the border to seek employment in the White created prosperity that was North America: an estimated 500,000 Mexicans entered America, legally and illegally, in the 1930s; one million in the 1940s; and 2.5 million in the 1950s.
Starting from 1975, the vast majority of immigrants into America have been from Nonwhite World countries from Asia and Latin America. More than 4 million newcomers entered the United States during the 1970s, rising to more than 6 million arrived in the 1980s; with at least 80 percent of these from Latin America or Asia.
During the 1990s another 10 million entered the country: the largest influx of immigrants in any decade in American history. In the 1980s, concern about the surge of illegal immigrants led Congress to pass legislation aimed at curtailing illegal immigration. The Immigration Reform and Control Act of 1986, mandated penalties for employers who hire illegal aliens.
Mexican Immigration
A 1996 report on population trends in America, issued by that country's official census office, revealed the full extent of Mexican (called "Hispanic") immigration and natural reproduction rates into that country: by the year 2005, Hispanics will surpass Blacks as the largest minority.
By the year 2050, it says, they will have increased from 10.7 per cent to 25 per cent of the population to outnumber the combined total of Blacks, Asians and Amerinds. From 2020, the report says, more Mexicans will be added to the population each year than Blacks, Asians and Amerinds combined. From 2019, the relatively youthful Mexican population will have America's lowest death rate.
White American Decline
The long-term rise in the number of Hispanics, who have the highest birth and immigration rates in America, will coincide with a decline in the number of Whites, the report states, predicting that by 2028, the number of White Americans dying will exceed those being born.
The population as a whole is projected to increase by 50 per cent by 2050, to 394 million, from 263 million in 1995. Although the White population is set to increase steadily in real numbers, expressed as a percentage of the entire American population, their numbers are in radical decline: in 1996, Whites made up 73.1 per cent of the population. That is projected to fall to 52.8 per cent by 2050.
USA Population Projections millions (rounded off)
| 1997 | 2000 | 2010 | 2020 | 2030 | 2040 | 2050 | |
| Total | 267 | 275 | 298 | 323 | 347 | 370 | 394 |
| White | 195 | 197 | 202 | 207 | 210 | 210 | 208 |
| White % of total | 72.8 | 71.8 | 68 | 64.3 | 60.5 | 57 | 52.8 |
Source: U.S. Bureau of the Census, Current Population Reports, Series P25-1130, "Population Projections of the United States by Age, Sex, Race, and Hispanic Origin: 1995 to 2050".
Germans Largest White Group
According to the 1990 census, the largest White group, about 58 million Americans, was partly or solely of German ancestry. Irish ancestry was reported by 38.7 million Americans, and English ancestry by another 32.7 million.
Children
Asians' share of the American population will more than double to 8.2 per cent in 2050, and Blacks will rise to 13.6 per cent. The Census Office also reported that in 1995, 21 per cent of White children, 33 per cent of Hispanic children and 56 per cent of Black children lived with one parent. Figures released by the US census Bureau in July 1998, showed that there were at that stage already more Mexican children than Black children in America.
According to the census bureau, in 1998 there were over ten million Mexican children under the age of eighteen. This has led to entire slices of many of the southern states of America: New Mexico, Texas and southern California, becoming virtual tiny replicas of Mexico, with the lingua franca becoming Mexican Spanish rather than English.
Asian Growth
According to the 1990 U.S. census, more than 7.2 million Asians and Pacific Islanders live in the United States. They made up 2.9 percent of the U.S. population, a 107.8 percent increase from 1980, when they constituted only 1.5 percent of the population. After the Vietnam War ended in 1975, many immigrants from Vietnam, Laos, Cambodia, and other Southeast Asian countries settled in the United States. Not all Vietnamese Americans have become well-educated and prosperous.
School dropout rates and the growth of criminal gangs continue to trouble the Vietnamese American community. In 1990, more than one-fourth of all Vietnamese American families reported income below the poverty level, a rate twice the U.S. average.
Black Growth
While the total U.S. population increased by 9.8 percent between 1980 and 1990 and by an estimated 7.4 percent between 1990 and 1997, the Black population grew by 14.2 percent, from 26.7 million in 1980 to 30.5 million in 1990 and had reached an estimated 33.8 million by 1997.
Amerind Growth
The Amerind population has staged a remarkable comeback from its low at the end of the 19th century: in 1980, it stood at 1.4 million, rising to 2.1 million in 1990; the population grew 12.1 percent between 1990 and 1997, reaching 2.3 million.
Racial Mixing
According to an article in the newspaper, USA Today, of 17 June 1998, the number of mixed race marriages in the USA was 150,000 in 1960. By 1998 it had increased to "over 1.5 million" and it estimated that the number of mixed race children in America stood at "over 2 million."
CANADA
According to Canadian government figures, from 1981 to 1991, 74 per cent of all legal immigrants to Canada came from Nonwhite countries. During this time there were 1.3 million legal immigrants: 26 per cent came from Europe; 47 per cent came from Asia (Chinese is the fastest-growing mother tongue in Canada); 12 per cent from South America or the Caribbean; 9 per cent from North and Central America, and 6 per cent from Africa.
Due to declining White birth rates - in 1997 the birth rate was 1.67 children born per woman, (less than the replacement rate of 2.1) the Canadian government formally decided in the 1980s to actively seek out further immigrants. The top ten source countries (in order) in 1995, were Hong Kong, India, the Philippines, China, Sri Lanka, Taiwan, Bosnia and Herzegovina, England, the United States, and Pakistan.
In 1997, Amerinds officially made up three per cent of the population (865 400), while officially Blacks made up two per cent (576 920). The established Asian population was swelled by 962 000 immigrants in the 1980s - pushing the total of Asians well over the 2,8 million mark.
These are all official figures of legal immigrants: illegal immigration always shadows legal immigration, and it is possible that the actual figures may be nearly double the legal ones.
Given that the total population of Canada in 1996 was 28,846,761, some three million or more legal Nonwhite immigrants have settled in that country prior to the year 2000. In terms of illegal immigrants, the number is of course far higher. All this translates to a Nonwhite population of just under 5 million - or 17 percent of the total population - in 1996. This figure is set to increase exponentially.
AUSTRALIA AND NEW ZEALAND
Prior to the 1970s, virtually all immigration to Australia was White: however, like the rest of Europe and North America, the last 25 years of the 20th century has seen a massive increase in Nonwhite immigration into Australia, mostly from Asian countries.
According to the 1991 census, Australia had a population of 16,849,496. The 1995 estimated population, including Christmas Island, Cocos Islands, and Norfolk Island, was 18,338,000.
Australia's total population grew at an annual rate of about 1.4 percent in the early 1990s. The principal reasons for this growth were the continued high level of immigration and the associated increase in the numbers of younger people in the childbearing and childrearing age groups.
Twenty Seven Percent
Some 70 per cent of Australian immigration in the 1990s came from Asian countries. At current levels, local research has shown that Australia will be 27 per cent Asian by 2025, with the Asians already concentrating in the cities, causing the well known White Flight phenomena into the suburbs and countryside.
An idea of the rapid Asian population growth can be determined if it is borne in mind that in 1980, Australia's non-Aboriginal Nonwhite population was 250,000. In the last 20 years of the 20th century, this figure has leapfrogged to nearly two million.
This is only based on legal Nonwhite immigration figures: Australian police estimated in 1998 that in that year, at least 500 illegal immigrants were entering that country every week, mostly on visitor's visas.
New Zealand
The population of New Zealand at the 1991 census was 3,434,950. The 1996 population estimate was 3,547,983. According to the 1991 census, approximately 73 percent of the population of New Zealand is White. About 12 percent (some 430,000) are Maori, with the rest being "other Asian" groups - again showing a growth which, when combined with the Maori population, will also start producing racial balances similar to those of Australia by the year 2030.
GLOBAL WHITE DECLINE
Given present immigration trends and natural Nonwhite population growth figures on all three continents - Western Europe, North America, and Australia - it therefore seems unlikely that any of them will retain their White majorities past the year 2100.
In addition to the ever increasing waves of Nonwhite immigration, another serious factor is the steady reduction in the White birthrate which is further accelerating the process of decline.
A report published in Britain in July 1998, by the Family Policy Studies Center, indicated that one in five women in the UK of childbearing age (that is, born after 1975) are not having any children, mainly due to financial constraints. The figure is double that for women born in 1945 - the numbers have been increasing since 1950.
World Wide
The massive increases in the world's total Nonwhite population also makes serious food for thought: in 1900, the earth's population stood at 1,625 million, with some 485 million being White. This meant that some 30 per cent of the earth's population was White at the beginning of the 20th century.
In the year 2000, the earth's population will stand at around 6,095 million, with around 953 million being White. Although this is an increase, in terms of the total planet's population, it marks a drop of over 50 per cent - in 2000, Whites will make up only 15 per cent of the earth's population.
The exponential and explosive growth of the Nonwhite population of the earth - which effectively doubles itself every 34 years -(compared with White population which now only doubles itself every 200 years), means that by the year 2100, only three per cent of the earth's population will be White.
From 1900 to 2010 - a period of 110 years, the proportion of Whites on earth will have dropped from 30 per cent to three percent.

The massive overpopulation taking place in the Nonwhite world will cause increasing waves of Nonwhite immigration into the modern White heart lands of North America, Europe and Australia. This graph shows the disparity between White and Nonwhite population growths, based on United Nations figures. Note the codeword for the White nations ("developed countries"), compared to the Nonwhite world ("total world population").
The Pill
The 1960s will also go down in history as having introduced one of the most significant factors to affect White numbers in the entire history of the world: the development of the birth control pill, or oral contraceptive, which was first approved for use in the United States in 1965. Social demographic trends have shown that it is only in the Western, White, industrialized countries where contraception is used to any significant degree.
The reproduction rate in White countries (amongst their native populations) has, since the introduction of the pill, dropped to the point where in most White countries it is below the stable replacement rate of 2.4 children per female. In the Nonwhite Third World however, no such restraints exist, and the population grows exponentially as fast as the White population declines in Europe and North America: this demographic time bomb will in the not to distant future have serious consequences for the entire earth.
Nonwhite Overpopulation Pushes Immigration
The resultant massive overpopulation of the Nonwhite lands of the earth provides the major driver for Nonwhite immigration into the White heart lands of Europe, Australia and North America.
In India, for example, where the population doubles every 30 years, many see no future except emigration to Australia, America or Europe, as over population pressures at home stretch their already tenuous infrastructure to breaking point.
The Black African population doubles every 24 years. This is reflected in the ever increasing number of man made famines on that continent; and the ever increasing numbers of Black refugees entering Europe, America and Australia.
All of these population shifts are busy altering the population make-ups of the three modern White heart lands - in exactly the same way that has happened to every other White nation in history which has then become swamped and removed from the pages of history.
or back to
or
All material (c) copyright Ostara Publications, 1999.
Re-use for commercial purposes strictly forbidden.