Table 4.7
Real Part of the Complex-Dielectric Constant (Relative Permittivitiy) of Various Body Tissues
(Letters designate footnotes found at end of table.)
Table 4.8.
Conductivity (S/m) of Various Body Tissues
(Letters designate footnotes found at end of table.)
Table 4.9
Temperature Coefficient Of Dielectric Constant Of Various Body Tissues  (Schwan, 1954)
Table 4.10.
Temperature Coefficient Of Conductivity Of Various Body Tissues  (Schwan, 1954)
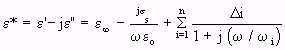 - (Equation 4.24)
where


 = relative-permittivity change due to dispersion associated with
  From Equation 4.24, we get
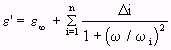 - (Equation 4.25)
and
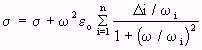 (Equation 4.26)
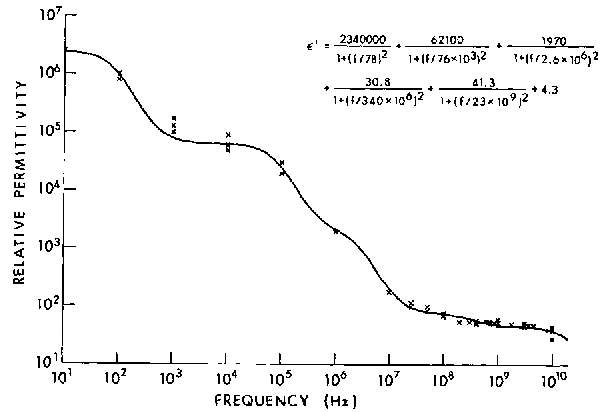
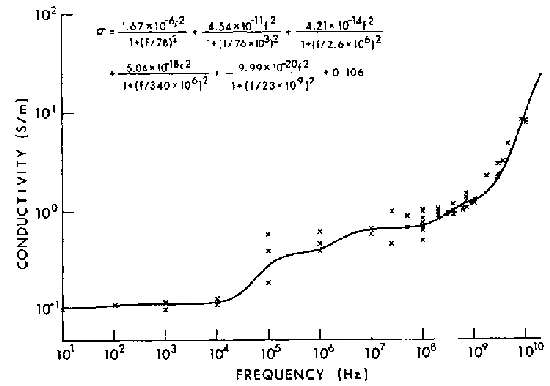
Hurt (1985) has written a Fortran program that performs a least-squares fit of Equations 4.25 and 4.26 to permittivity data. Figures 4.12 and 4.13 are the curves for relative dielectric permittivity and conductivity,
respectively, that result from fitting a 5-term Debye relation to muscle data (Tables 4.7 and 4.8). For muscle,  is set equal to 4.3 (Grant et al., 1978; Hill, 1963).
Figure 4.12.
Relative dielectric permittivity for muscle (W. D. Hurt, private communication, USAF School of Aerospace Medicine, 1985).
Figure 4.13.
Conductivity for muscle (W. D. Hurt, private communication, USAF School of Aerospace Medicine, 1985).
Figure 4.14.
Measured values of relative dielectric constant of in vivo rat muscle and canine muscle (Burdette et al., 1980) compared to reference data (Schwan, 1975).
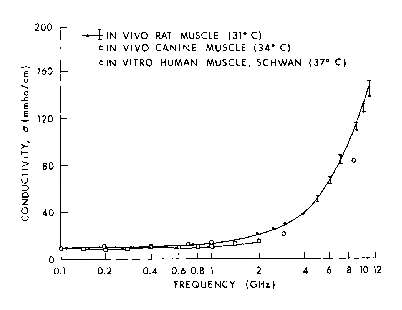
Figure 4.15.
Measured values of conductivity of in vivo rat muscle and canine muscle (Burdette et al., 1980) compared to reference data (Schwan, 1957).
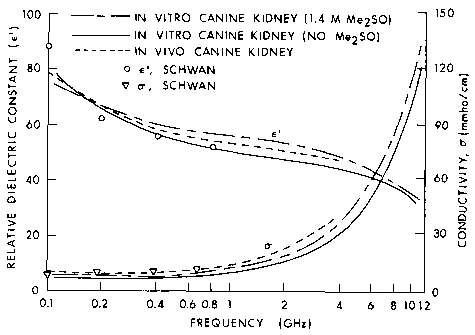
Figure 4.16.
Measured values of relative dielectric constant and conductivity of in vivo and in vitro canine
kidney cortex (Burdette et al., 1980) compared to reference data (Schwan, 1957).
Figure 4.17.
Measured values of relative dielectric constant and conductivity of in vivo canine fat tissue at
37ºC (Burdette et al., 1980).
Figure 4.18.
Measured values of relative dielectric constant and conductivity of in vivo rat brain at 32°C. Maximum SEM for ![]() ' is indicated by error bars and SEM for
' is indicated by error bars and SEM for ![]() " = ± 0.9 (Burdette et al., 1980).
" = ± 0.9 (Burdette et al., 1980).
Figure 4.19.
Measured values of relative dielectric constant and conductivity of rat blood at 23°C (Burdette et al., 1980).
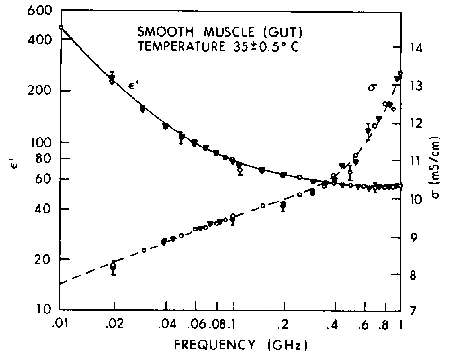
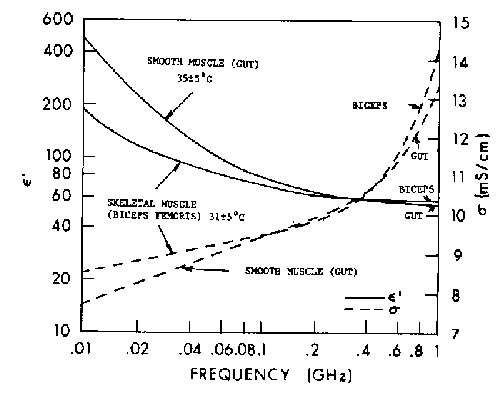
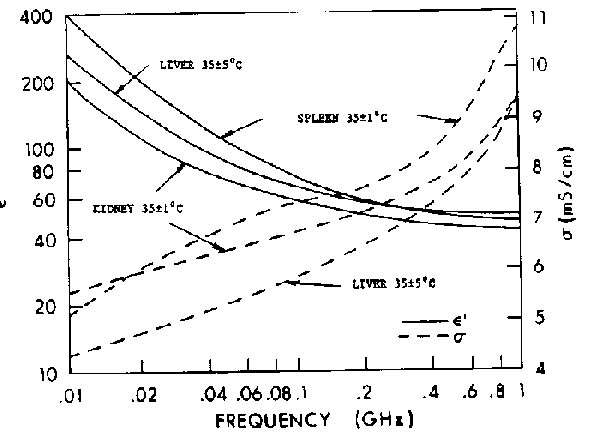
Figures 4.20-4.24 show recently obtained in vivo data for several feline tissues at frequencies between 10 MHz and 1 GHz (Stuchly et al., 1981). These figures show significant differences in the properties of different types of the same tissue (e.g., skeletal and smooth muscle).
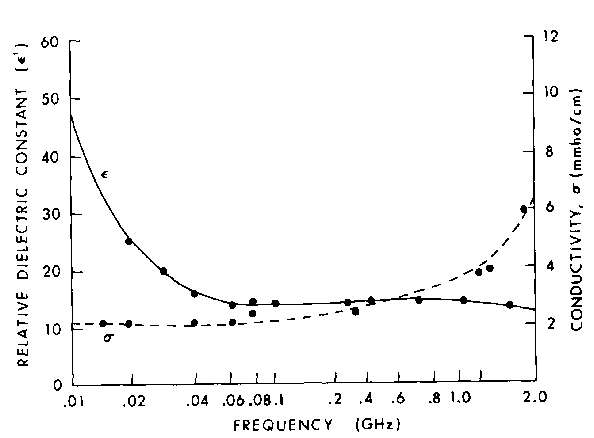
Figure 4.20.
Relative permittivity of cat smooth muscle in vivo: ![]() and O show results obtained for two locations in the tissue. The vertical bars show the uncertainty due to the estimated measurement errors (SD) (Stuchly et al., 1981).
and O show results obtained for two locations in the tissue. The vertical bars show the uncertainty due to the estimated measurement errors (SD) (Stuchly et al., 1981).
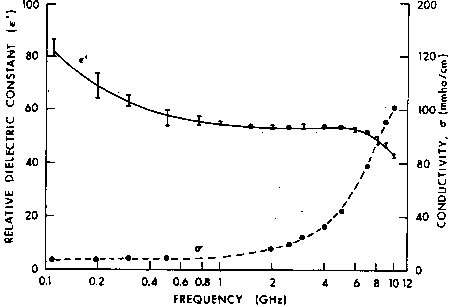
Figure 4.21.
Relative permittivity of cat spleen in vivo: ![]() and O show results obtained for two locations; the vertical bars show the uncertainty due to estimated measurement errors (SD) (Stuchly et al., 1981).
and O show results obtained for two locations; the vertical bars show the uncertainty due to estimated measurement errors (SD) (Stuchly et al., 1981).
Figure 4.22.
Average relative permittivity of two types of cat muscle in vivo (five samples for each point) (Stuchly et al., 1981).
Figure 4.23.
Average relative permittivity of cat internal organs in vivo (three to five samples for each
point) (Stuchly et al., 1981).
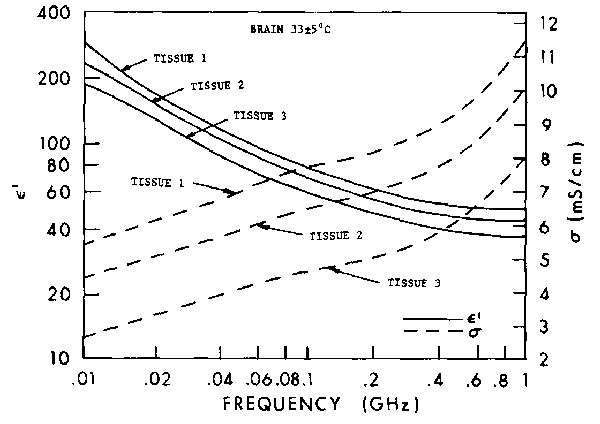
Figure 4.24.
Relative permittivity of cat brain: tissue 1 -- gray matter; tissue 2 -- gray matter, 3 mm thick over white
matter; tissue 3 -- white matter (Stuchly et al., 1981).
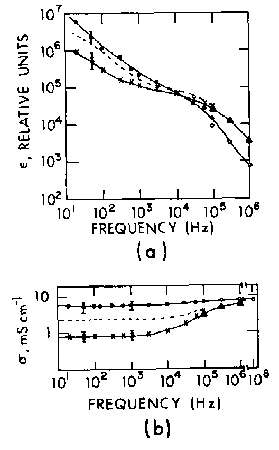
Figure 4.25.
The real part of the dielectric constant (a) and the conductivity (b) of the canine skeletal muscle tissue at 37°C as a function of frequency, in parallel orientation (open and closed circles) and perpendicular
orientation (crosses and triangles), averaged over five measurements on different samples, The dotted lines are the
data for non-oriented muscle tissue (Epstein and Foster , 1983).
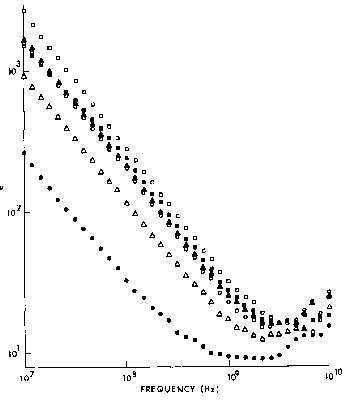
Figure 4.26.
The real part of the dielectric constant,  ', of ocular tissues at 37°C (Gabriel et al., 1983).
Key:
', of ocular tissues at 37°C (Gabriel et al., 1983).
Key: ![]() retina,
retina, ![]() iris,
iris, ![]() choroid,
choroid, ![]() cornea,
cornea,  lens cortex, and
 ![]() lens nucleus.
lens nucleus.
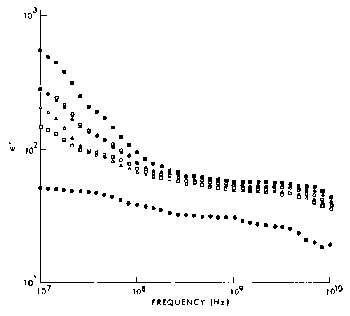
Figure 4.27.
The imaginary part of the dielectric constant, ", of ocular tissues at 37·C (Gabriel et al.,
1983). Key: ![]() retina,
retina, ![]() iris,
iris, ![]() choroid,
choroid, ![]() cornea, lens cortex, and
cornea, lens cortex, and ![]() lens nucleus.
lens nucleus.
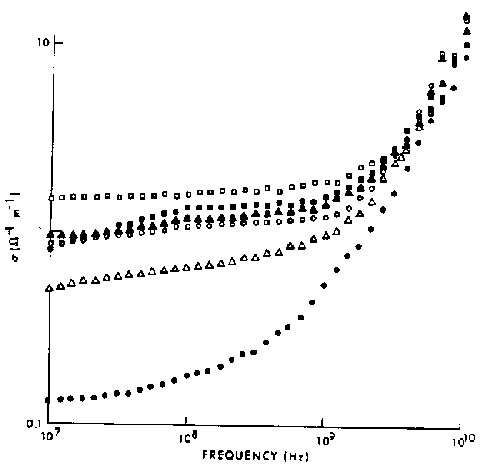
Figure 4.28.
The conductivity of ocular tissues at 37ºC (Gabriel et al., 1983). Key: ![]() retina,
retina, ![]() iris,
iris, ![]() choroid,
choroid, ![]() cornea, lens cortex, and
cornea, lens cortex, and ![]() lens nucleus.
lens nucleus.
Figure 4.29.
Real part of the dielectric constant, ' , of normal and tumor mouse tissue as a function of frequency
(Rogers et al., 1983). ![]() mouse muscle,
mouse muscle, ![]() KHT fibrosarcoma tumor,
KHT fibrosarcoma tumor, ![]() RIF/1 fibrosarcoma tumor.
RIF/1 fibrosarcoma tumor.
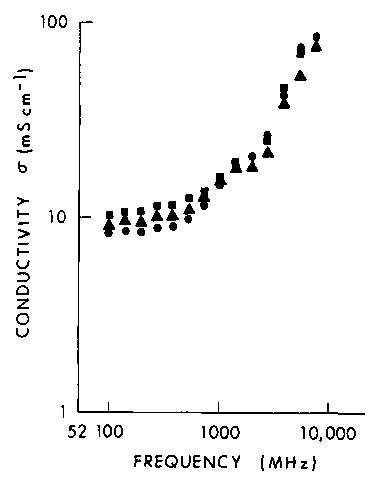
Figure 4.30.
Conductivity of normal and tumor mouse tissue as a function of frequency (Rogers et al., 1983). ![]() mouse muscle,
mouse muscle, ![]() KHT fibrosarcoma tumor,
KHT fibrosarcoma tumor, ![]() RIF/I fibrosarcoma tumor.
RIF/I fibrosarcoma tumor.
Go to Chapter 5.1
Return to Table of Contents.
Last modified: June 24, 1997
© October 1986, USAF School of Aerospace Medicine, Aerospace Medical Division (AFSC), Brooks Air Force Base, TX 78235-5301
This is a Department of Defense computer system for authorized use only. DoD computer systems may be monitored for all lawful purposes, including to ensure that their use is authorized, for management of the system, to facilitate against unauthorized access, and to verify security procedures, survivability, and operational security. Using this system constitutes consent to monitoring. All information, including personal information, placed on or sent over this system may be obtained during monitoring. Unauthorized use could result in criminal prosecution.
POC: AFRL/HEDM, (210)536-6816, DSN 240-6816