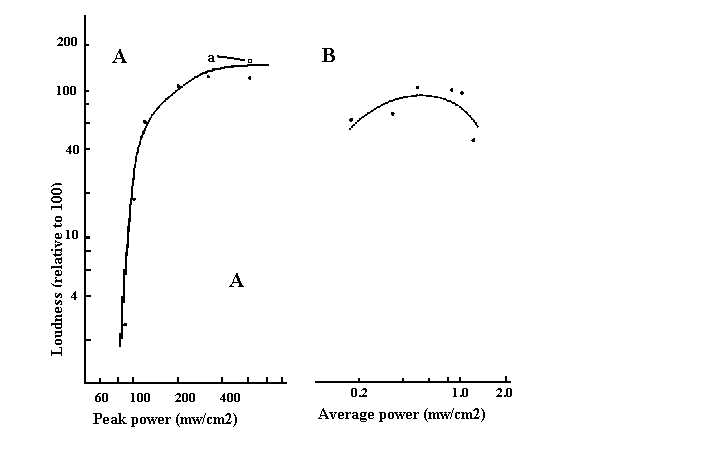
Figure 1 - Perceived Loudness Plotted as a Function of Peak Power
Abstract - A psychophysical study of the perception of "sound" induced by illumination with pulse-modulated, ultrahigh-frequency electromagnetic energy indicated that perception was primary dependent upon peak power and secondarily dependent upon pulse width. The average power did not significantly affect perception. Perceived characteristics of pitch and timbre appeared to be functions of modulation.
Field tests with radar indicate that humans and cats perceive low-power pulse-modulated, radio-frequency (RF) energy (1-3). Human subjects reported they perceived "sounds" that were in the nature of buzzes and hisses. The energy perceived was not acoustic energy; rather, it was electromagnetic (EM) energy in the ultrahigh-frequency (UHF) band of the spectrum. These findings can be related to other reports of sensory and behavioral phenomena associated with low-power RF energy. Analytical reviews of these and other reports and implications of the reviewed reports that bear on our understanding of information transfer and storage in living organisms can be found in the literature (3-5).
In the field tests with radar, Allen H. Frey determined the portion of the EM spectrum that was effective in inducing the "sounds" and the approximate thresholds. Perception occurred when the subject was illuminated with energy from approximately that portion of the EM spectrum defined as the UHF band, that is from 0.3 to 3 GHz (6). This is the portion of the spectrum at which EM energy passes into and through the head. At higher frequencies the energy is largely absorbed by the skin, and at lower frequencies it tends to be reflected by the body (2). An approximate threshold for perception, when the subject was in a noisy environment, occurred at a peak power density of 267 mw/cm² and an average power density of 0.4 mw/cm². The data suggested that the average power was not an important variable, but no definitive statement about its role in perception could be made. The perception had the following characteristics, (.i) it did not involve an energy transduction of EM to acoustic energy, for example, by fillings in the teeth; (ii) it differed from the electrophonic effect; and (iii) it could not be accounted for by an explanation involving radiation pressure against the skin (3, 4).
The field studies raised questions that could not be answered at that time because of lack of suitable laboratory sources of RF energy. Suitable RF energy sources are now available. Thus, we address ourselves to the following questions.
We performed a series of psychophysical experiments with humans placed in an RF anechoic chamber. The RF anechoic chamber constructed of RF energy absorber (Eccosorb FR 340) minimised RF energy reflections. The EM energy source was a pulse signal source (Applied Microwave Laboratory) emitting energy at a carrier frequency of 1.245 GHz. The energy was conveyed by air line (General Radio model 874) and RG-8 coaxial cable to a coax-to waveguide adaptor (Scientific Atlanta model 11-1.1) and standard-gain horn antenna (7).
The horn antenna emitted the energy within the RF anechoic chamber. The antenna was orientated such that the energy was vertically polarised, although pilot experiments indicated that horizontally polarised energy yielded similar data. The RF parameters used are shown in Table 1. The pulse repetition rate was selected so that it produced a buzzing "sound."
Table 1
Radio frequency parameters used at each test condition. A pulse rate of 50 pulses per second was used in each case. The constant values shown were rounded for clarity.
Test                 Peak                 Average          Pulse
Condition            Power                Power            Width
Number               (mW/cm²)             (mW/cm²)         (µsec)
-----------------------------------------------------------------
1                      90                   0.32              70
2                     105                   0.32              60
3                     125                   0.32              50
4                     210                   0.32              30
5                     315                   0.32              20
6                     630                   0.32              10
6a                    630                   1.26              40
-----------------------------------------------------------------
Note: Peak Power Varied
-----------------------------------------------------------------
1                     370                   0.19              10
2                     370                   0.37              20
3                     370                   0.55              30
4                     370                   0.93              50
5                     370                   1.11              60
6                     370                   1.29              70
-----------------------------------------------------------------
Note: Average Power Varied
-----------------------------------------------------------------
All RF energy measurements reported here were taken with a half-wave dipole antenna located where the centre of the subjects head was placed during data collection. The dipole antenna was supported by a wooden pole in order to minimise field disturbance during measurement. The dipole was connected by an RG-58 coaxial cable to an attenuator (Microlab model AF 20) outside the chamber. The attenuator was connected to a thirmistor mount (Hewlett-Packard model 430C) The cable within the chamber was oriented for minimum field disturbance. This measurement equipment yields an average power measurement from which the peak power is derived by the standard duty cycle formula (8). The signal attenuation due to the cable and to the attenuator is accounted for in the reported measurements. There is an inherent and unspecifiable error in the EM field-distorting effect of the measuring instrument and the biological object.
The psychophysical technique of magnitude estimation was used in these experiments. Four trained subjects with clinically normal hearing were tested individually within the RF anschoic chamber. The subject sat on a wooden stool with his back to the horn antenna. We fixed his head in space by having him place his chin on an acrylic rest mounted on a vertical wooden pole. He used a multikey hand switch to signal a number as a report of the loudness he perceived. The subject was told that the first RF sound he would hear in each trial would be a reference sound that was assigned the number 100 and that the second sound he heard would differ in loudness from trial to trial. It was the subject's task to assign a number to the loudness of the second RF sound with reference to the first RF sound. The reference RF sound was selected as being approximately in the middle loudness range. A brief dim light signaled the subject that a trial would begin. After a variable period of up to 5 seconds, the reference RF sound was presented for 2 seconds. A silent period of approximately 5 seconds followed, and then the RF sound of variable loudness was presented for 2 seconds. The subject would then indicate with the hand switch the number he assigned to the loudness. On some occasions, in order to account for the possibility of false positives, no RF sound was presented at the time that the variable rf sound should have been presented. Before starting a session, the subject was given two warm up trials. Each test condition (Table 1) is defined by a specific peak power, average power, pulse width, and pulse repetition rate. We randomised the order of presentation of these sets of RF parameter by using a table of random numbers. There were three randomised repetitions of the series.
The results are presented in Figure 1.
Figure 1 - Perceived Loudness Plotted as a Function of Peak Power
The data from each subject consisted of three repetitions of each set of RF parameters shown under each test condition in Table 1. The average power was held constant by decreasing the pulse width while raising the peak power (B). Perceived loudness plotted as a function of average power for the same subjects as in (A). The average power was increased by increasing the pulse width while holding peak constant.
The point plotted for each test condition number represents the median of all subjects and all repetitions. The graph shown in Figure 1A was derived from the results of a test series in which we studied the effect of varying the peak power while holding the average power constant, as specified in Table 1. The average power as held constant by varying the pulse width. The graph shown in Figure 1B was derived from the results obtained in a series of tests in which the average power was allowed to vary while the peak power was held constant, as specified in Table 1. The data obtained were reliable, as is typical from trained subjects in psychophysical experiments. The curves fitted to the data are estimations and are intended only as a guide for the reader's eye. The precise shape or slope of the curves will require many more studies for definition because of the sensitivity of judgements of sensory magnitude to details of experimental procedure (9).
Once a minimum pulse width is used, perceived loudness is a function of peak power (Figure 1, A & B). The location of the point for test condition 6 is in consistent with what would be expected. The data represented by this point were obtained when a 10 µsec pulse width was used. Since a consideration of all data shown in Figure 1 indicates that this pulse width is outside the optimal band for loudness, we tested the possibility that the apparent inconsistency was due to the use of a nonoptimal pulse width. We therefore presented to the subjects the same peak power, but with a pulse width within the optimal band, that is, 40 µsec. The average of the data so obtained is represented by the square labelled "a" in Figure 1A. Its location indicates that the apparent decrease in perceived loudness at test condition 6 is due more to the pulse width being less than optimal than to an actual decrease in perceived loudness at the high peak power level. The data plotted in Figure 1B indicate that, in addition to an apparent minimum pulse width, there may be a maximum pulse width defining an optimal band of pulse widths for perceived loudness. It appears that average power does not determine loudness except when it is incidentally involved in producing a minimum pulse width for optimal effect.
In one test series, we varied the average power by changing the pulse repetition rate while holding the pulse width constant. We found that the quality of the sound is in part determined by the repetition rate. The subjects reported sounds that had pitch as well as timbre characteristics. This confused subjects who were instructed to judge loudness. The data do not support the hypothesis of radiation pressure against the skin conveyed by bone conduction to the ear; the energy available is far below the threshold for bone conduction. Nor do the data support a mechanism involving radiation pressure against the tympanic membrane, external auditory meatus, or round window. For example, there are no significant effects of changing head orientation as would be expected if radiation pressure was an important factor. Moreover, a series in which the Gelle test (10) was used with plastic air tubes yielded negative results for RF sound and positive results for acoustic sound.
In summary, the perceived loudness of the RF sound as judged by the magnitude estimation technique, and within the limitation of the RF parameters investigated here, is a function of peak power rather than average power. Calculations from the data presented indicate that in this particular experiment, the peak power required for perception is somewhat less than 80 mW/cm². A band of optimal pulse widths seems to exist for the effect. There are also rf modulation parameters that cause subjects hearing "sounds" with definite pitch and timbre characteristics.
Allan H. Frey
Rodman Messenger, Jr.
References and Notes
7 February 1972: revised 5 April 1973.